Competency Heatmap
Visualize candidate performance across all competencies in a color-coded grid.
The competency heatmap shows how every scored candidate performed across every competency. It appears on the posting detail page when two or more candidates have completed their interviews.
Reading the Heatmap
| Dimension | Represents |
|---|---|
| Rows | Candidates, sorted by overall score (highest first) |
| Columns | The competencies on your posting |
| Cell color | The score for that candidate on that competency |
Color Scale
| Color | Score Range | What It Means |
|---|---|---|
| Red | 1-2 | Below expectations |
| Orange | 2-3 | Needs improvement |
| Amber | 3-3.5 | Adequate |
| Green | 3.5-5 | Strong to exceptional |
What to Look For
Column patterns reveal competency-level trends. An entire column of red or orange means candidates are consistently struggling with that competency. Possible causes:
- The competency is unusually difficult for your candidate pool
- The behavioral anchors may need refinement
- The job description doesn't clearly signal this requirement
Row patterns reveal candidate profiles. All-green means strong across the board. Mixed colors may indicate a specialist.
Outlier cells stand out visually. A single green cell in an otherwise red column signals a rare strength worth noting. A single red cell in an otherwise green row signals a specific gap worth exploring in follow-up interviews.
Interacting with the Heatmap
- Click a score cell to see the candidate's response quote, evidence, and scorer analysis for that competency
- Click a candidate name to navigate to their full profile and scorecard
If your administrator has configured a custom score scale (e.g., 1-7 instead of 1-5), the colors adjust to match that range automatically.
Server-side paging at scale
The heatmap loads in batches of 50 candidates at a time. The header shows your current view, for example "(showing 50 of 281 candidates)". Scroll the table toward the bottom and the next 50 rows append automatically (a small "Loading more..." indicator appears during each fetch). When every page has loaded, an "All candidates loaded" footer appears.
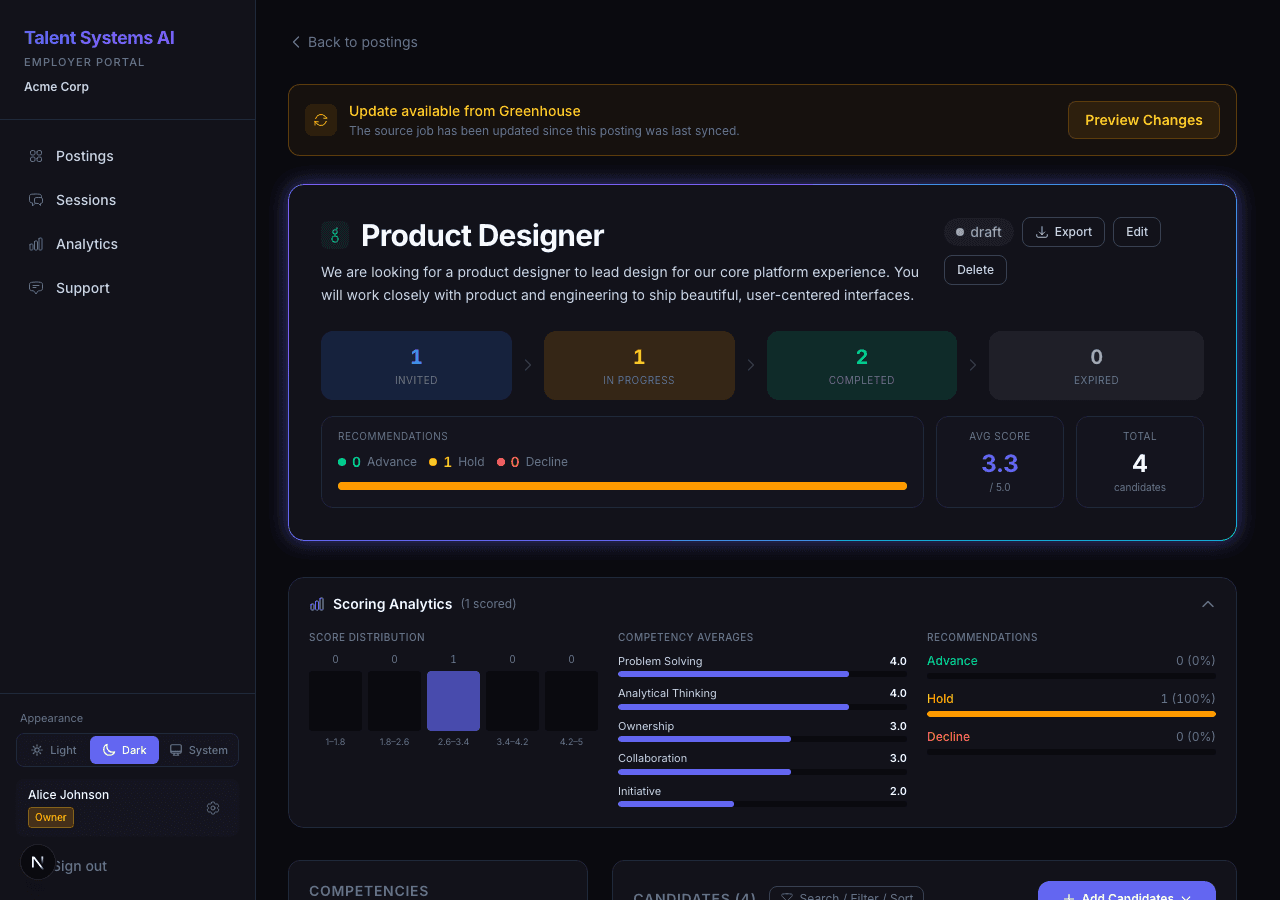
This keeps postings with hundreds or thousands of scored candidates from stalling the browser. The score distribution, competency averages, and recommendation breakdown shown beside the heatmap are always computed across the full set of scored candidates, never just the page that is currently visible, so the headline numbers are stable as you scroll.
Candidates are ordered by overall score (highest first), so the strongest candidates load on page one without needing to scroll.